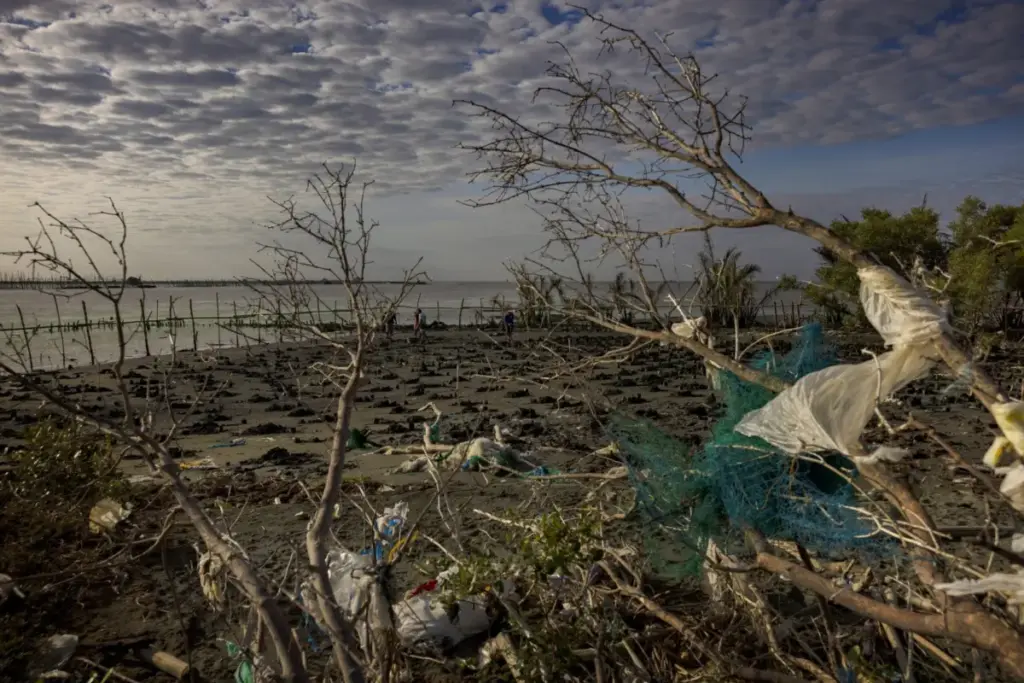
Faulty environmental data is not merely an academic problem confined to university lecture halls and research laboratories. In the real world, inaccurate reporting can lead directly to flawed government policies, billions of dollars in wasted resources, and dangerous regulatory gaps that ultimately put human health at serious risk. The global fight against persistent pollution and the urgent effort to mitigate catastrophic climate change depend fundamentally on data that accurately reflect the physical world. When official reporting misses what is actually happening on the ground, public policy runs the profound risk of addressing only a fraction of the problem, leaving communities vulnerable and emissions unchecked.
Policymakers, financial investors, and other high-level decision-makers rely heavily on the accuracy, completeness, consistency, and timeliness of international data. Sustainability policies, rigorous scrutiny of binding international agreements, and the allocation of billions of dollars in global green finance draw extensively on statistical reports produced by prestigious institutions and organizations. These include the United Nations, the United Nations Development Programme (UNDP), Eurostat, the European Environment Agency (EEA), the Food and Agriculture Organization (FAO), and industry bodies such as Plastics Europe. Consequently, discrepancies between officially reported figures and actual conditions on the ground deserve intense, immediate attention from regulators and the public alike.
Established frameworks such as the International Monetary Fund’s Data Quality Assessment Framework (DQAF) and the United Nations’ National Quality Assurance Frameworks (NQAF) place heavy emphasis on whether statistical outputs are genuinely fit for use. Yet, the inherent complexity of pollution data, methodological differences between national reporting systems, and corporate greenwashing can severely undermine their reliability. Fragmented or incomplete observational records also limit their practical usefulness in high-stakes decision-making environments.
The stakes extend across a vast spectrum, ranging from greenhouse gas emissions and the complex global trade in plastic waste to precise air-quality measurement, environmental protection expenditures, and corporate environmental, social, and governance (ESG) reporting. Data quality cannot be reduced to a simple mathematical measure or a singular metric. Instead, it is multidimensional, shaped heavily by the dynamic interaction between data acquisition methods, user expectations, regulatory conformance, and real-world plausibility.
The System of Environmental-Economic Accounting (SEEA), adopted by the U.N. Statistical Commission, and the FAOSTAT Data Quality Framework provide vital reference points for environmental statistics. A multidimensional approach to data quality is particularly important when monitoring complex agri-environmental indicators, including agricultural methane and nitrous oxide emissions, which heavily influence global warming projections.
More data, but not enough progress
Monitoring the Sustainable Development Goals (SDGs) provides a substantial test of global environmental data quality. Within the framework’s 17 goals and 169 targets, the United Nations Environment Programme (UNEP) has closely assessed 92 environment-related indicators. Its comprehensive "Measuring Progress" series examines both the lingering gaps in available data and the environmental trends that those figures ultimately reveal.
Data availability and environmental progress, however, are not the same thing. UNEP reported that the share of environment-related SDG indicators with sufficient data for proper analysis rose from 34% in 2018 to 42% in 2020 and 59% in 2022. For the 2022 assessment, 38% of all 92 environment-related indicators showed positive trends indicating actual environmental improvement. Crucially, this measures progress in tangible environmental outcomes, not an inherent improvement in the quality of the statistics themselves. UNEP’s assessment ultimately indicated that the world was still not on track to meet the ambitious environmental targets of the 2030 Agenda for Sustainable Development.
Traditional statistical approaches can struggle significantly to capture complex ecological interactions. Differences in national data quality assessment frameworks, outdated information, inconsistent measurement methods, and inadequate institutional infrastructure can further weaken SDG reporting across various jurisdictions.
Environmental variables should not be assessed in isolation from one another. Examining intricate relationships among recycling rates, air quality, and marine pollution requires sufficiently complete, disassociated datasets. These relationships need to be thoroughly investigated, rather than hastily treated as an established sequence of straightforward cause and effect. To effectively address persistent data gaps, traditional statistical methods should be complemented by advanced remote sensing, in-situ ground sensors, and citizen science initiatives, with artificial intelligence supporting the deep analysis of robust environmental data.
What methane inventories miss
Methane reporting illustrates the severe consequences of gaps in environmental data. Methane is a potent greenhouse gas possessing a much greater heat-trapping effect than carbon dioxide over a 20-year timescale. Numerous scientific studies have identified substantial, concerning differences between bottom-up emission inventories—including those submitted to the United Nations Framework Convention on Climate Change (UNFCCC)—and top-down estimates derived directly from independent atmospheric observations.
Traditional bottom-up methods use generalized emission factors to estimate releases from industrial activities and heavy equipment. These methods can heavily underrepresent the large, sudden releases associated with unexpected equipment failures, underground leaks, isolation-valve leakage, and abnormal operating conditions.
A landmark study by Robert Alvarez and colleagues, published in the journal Science, vividly demonstrated this problem within the United States oil and gas supply chain. The research estimated total methane emissions in 2015 at 13 teragrams a year, approximately 60% above the official inventory estimate put forward by the U.S. Environmental Protection Agency. Production, gathering, and processing accounted for about 85% of the study’s national bottom-up estimate.
The researchers identified emissions released under abnormal operating conditions as a highly likely explanation for much of the observed gap. Such tail-heavy emission distributions mean that a small minority of high-volume sources, often referred to as superemitters, can account for a disproportionately large share of total emissions. Inventories that fail to capture these sporadic events risk drastically understating the scale of the problem.
Satellite observations offer a vital, independent perspective on these discrepancies. The Tropospheric Monitoring Instrument aboard the European Space Agency’s Sentinel-5P satellite uses shortwave infrared measurements to observe atmospheric methane from space. Observations at high spatial resolutions can successfully support regional emission estimates and allow direct comparisons with official inventories.
In Canada’s Montney basin, a TROPOMI analysis of natural gas operations estimated methane emissions at 2.6 kilotonnes a day, coming in above the inventory estimate used in the study, albeit with substantial statistical uncertainty. Pixels containing active gas facilities showed methane concentrations averaging 11 parts per billion above the normal background levels. These findings raise serious questions about how accurately traditional inventories capture emissions in the area examined.
In Queensland, Australia, a TROPOMI analysis estimated that six prominent coal mines emitted 570 gigagrams of methane a year during the 2018-2019 period. Although these specific mines accounted for just 7% of national coal production, their estimated emissions were equivalent to about 55% of all coal-mining methane emissions that Australia officially reported to the UNFCCC.
In South America, satellite-based inversion models provide yet another way to assess inventories compiled using Intergovernmental Panel on Climate Change guidelines. One analysis estimated annual anthropogenic methane emissions of 19 teragrams for Brazil, 9.2 for Argentina, and 7.0 for Venezuela. Such advanced analyses also allow closer examination of individual sectors, including livestock and enteric fermentation, rather than relying solely on generalized national totals.
These studies clearly demonstrate why global climate targets and net-zero emissions projections need a sound, verified baseline. Where inventories systematically underestimate emissions, they can badly distort assessments of mitigation needs and weaken the legal evidence supporting carbon pricing mechanisms and emissions trading systems. Satellite-supported monitoring should be seamlessly integrated into official inventory verification, accompanied by clear regulatory requirements for reconciling estimates and investigating discrepancies.
When plastics accounting misleads
Plastic pollution presents a completely different set of measurement challenges for environmental authorities. Discrepancies in how individual countries calculate packaging waste and recycling rates can severely complicate direct comparisons even within the European Union. Eurostat figures for 2023 put packaging waste across the EU-27 at 177.8 kilograms per person, with plastic accounting for roughly 19.8% of the total, or 15.8 million tonnes.
Separately, a detailed comparison of packaging-waste reporting using 2019 data put Ireland at 65 kilograms of plastic packaging waste per person, a striking 87% above the EU average. That massive difference cannot simply be read as a variation in consumer habits or consumption. Ireland utilized Waste Analysis based on direct waste measurements, while the vast majority of EU countries relied on the Placed on the Market approach. The choice of methodology can drastically affect the final quantities reported.
The PoM method relies heavily on industry declarations submitted under Extended Producer Responsibility schemes. These declarations can contain significant gaps arising from under-reporting, commercial freeriding, and the legal exclusion of small producers below specified thresholds under de minimis rules. Differences in regulatory coverage can therefore contribute to lower reported quantities under PoM compared to physical waste analysis.
Such methodological differences severely limit the comparability of circular economy indicators and must be addressed when interpreting European waste statistics. Without rigorous scrutiny, incomplete reporting can easily obscure the true scale of the global plastic waste crisis.
Chemical recycling raises further fundamental questions about how recycling performance is measured and verified. Industry promoters heavily champion these complex processes for materials that are historically difficult to recycle mechanically, such as contaminated or multilayer plastics. Pyrolysis and gasification break down plastic waste through energy-intensive thermal processes. Their inclusion in official recycling statistics, particularly through the mass balance approach, requires careful scrutiny of what the resulting figures actually represent.
In a petrochemical steam cracker, pyrolysis oil derived from recycled plastic waste may be mixed with a much larger quantity of virgin fossil feedstock. Once these raw inputs are physically mixed and processed together, tracing their respective contributions to an individual manufactured product becomes extremely difficult. An accounting allocation is fundamentally not the same thing as a direct physical measurement of that product’s recycled content.
Depending on the specific allocation rules applied, the recycled share of the input can be assigned to selected consumer outputs, such as packaging. This creates a distinct risk of misleading marketing claims when the vital distinction between an allocated accounting share and actual physical recycled content is not explicitly made clear.
Allocation rules, including fuel-use exempt allocation, therefore need to be thoroughly assessed against what they actually count and exclude. The absence of strict molecule-level traceability does not establish that a particular package contains zero recycled material. However, claims about recycled content should make their underlying accounting basis transparent, rather than implying a degree of physical certainty that the calculation method cannot possibly demonstrate.
Environmental organizations, including Zero Waste Europe, the Rethink Plastic Alliance, and the Natural Resources Defense Council, have frequently challenged industry claims regarding the true circularity and environmental benefits of chemical recycling. The calculation of carbon savings reported as avoided emissions in life cycle assessments also warrants deep regulatory scrutiny to determine whether the reported benefits are genuinely supported by robust underlying methods and evidence.
Accounting methods that overstate actual recycling performance risk unfairly disadvantaging traditional mechanical recycling and obscuring the critical distinction between material recycling and basic incineration. Clear definitions and transparent reporting are urgently needed to prevent a recycling success story existing merely on paper from being mistakenly interpreted as a demonstrated environmental benefit.
At the Geneva meeting of the Intergovernmental Negotiating Committee’s fifth session, known as INC-5.2, negotiations on a landmark Global Plastics Treaty ultimately ended without reaching a formal agreement on a final text. Clear definitions and comparable, reliable data remain absolutely essential to assessing policies on plastic production and recycling moving forward.
Environmental data should be designed to support rigorous scrutiny rather than provide convenient cover for greenwashing. Bottom-up inventories and industry-led declarations must be subject to cross-validation against independent top-down estimates and dense sensor-network measurements, with artificial intelligence aiding the broader analysis. Achieving this requires strict oversight of how data are collected, processed, and reported, rather than simply an increase in the sheer volume of data collected.
Accurate data represent far more than a routine statistical output; they actively help determine the direction and efficacy of global environmental policy. A sound route is of little practical use when the navigational instruments guiding it are fundamentally unreliable. Transparency, strict accountability, and physical traceability must become routine parts of all environmental reporting. Genuine progress against global pollution must be visibly demonstrated in the physical world, not merely recorded favorably on paper.
(The views and opinions expressed in this article are solely those of the author. They do not necessarily reflect the editorial stance, values, or position of Daily Sabah, which provides space for diverse perspectives as part of its commitment to open and informed public discussion.)